SVG
On a computer, every image is made out of pixels in various colors. The color of each pixel can be representad by 3 basic color-factors: Red, Green, and Blue (RGB).
If on the screen there are a lot of small pixels, if the screen has a good resolution, then the image is very smooth. People won’t notice that the image is made of pixels. Still they are just pixels.
If we would like to change the size of the image we have to figure how to handle the pixels.
There are various formats to store such images that you are familiar with: PNG, JPG etc.
Together all these are called raster images.
There is an alternative that can be good for some images. We can store instructions on how to draw various shapes. When the computer needs to display such an image it follows the instructions and draws the shapes.
These images are called vector images.
There are several such system. We are going to discuss SVG - the Scalable Vector Graphics.
In SVG we basically give instructions to the computer “draw this line”, “draw this circle”, etc. The executes these commands and the image is drawn on the screen when the user loads the file.
Raster images are much better suited for pictures (the ones we take of people or in nature), vector images are better suited for drawings, graphs, icons, etc.
One advantage of SVG over raster images is that because they are drawn at the time of display based on basically mathematical functions, we can easily resize them without losing quality. With a raster image when we shrink it we’ll have to decide how to merge pixels with different colors into less pixel or how to split a pixel to multiple pixels if we are trying to enlarge the image.
See the grid example.
For further detail there are a number of links. One of them is the
-
SVG: Scalable Vector Graphics on Mozilla including a nice tutorial.
-
A collection of SVG icons.
Introduction
In order to display an SVG image on an HTML page SVG we can embed the SVG in the HTML file, we can load an external SVG file via the img tag, or we can have JavaScript code generate the SVG on-the-fly.
We can also use any of the “back-end” languages to generate the SVG code and save it on the disk later to be served by the web-server or it can send it back to the client immediately.
- First we’ll see how we can display SVG images on an HTML page.
- Then we’ll examples of some basic shapes followed by some more complex drawings.
- After that we’ll have examples generating SVG in a number of programming languages.
Why SVG? Why this book?
As you might know I organize Meetups and for every event I need a promotional banner to put on the Meetup page and to share on various social networks. I also publish books via LEanpub that need a cover page. Another image. I also record videos and share them on YouTube where I need to add thumbnails.
I am not good at creating drawings and I especially dislike the fact that I cannot easily make small changes to an image and that I cannot properly track the chanages. So a while ago I started to write a command line tool in Rust called Banner Builder that allows me to define the content of an image using a YAML file and then generated the image. The project did not make a lot of progress and the images I could create were, well, not very nice.
Recently I had this brilliant idea to try to do the same thing using SVG. After all SVG is text-based (XML based) and thus I can use git for version control. I can easily make small changes to a file using a plain text editor. I also already had several earlier encounters with SVG. Both manuaally and programmatically. As I realized later I even maintain a Perl-based library called SVG for a while.
So I decided to go on another adventure learning SVG (again) and starting to prepare the images using SVG.
SVG and LLMs
See Pie Charts
Generate an SVG of a pelican riding a bicycle by Simon Willison Some of the generated images are absolute garbage others are really good.
SVG embedded in HTML
There are several ways to display and SVG image on a web pages.
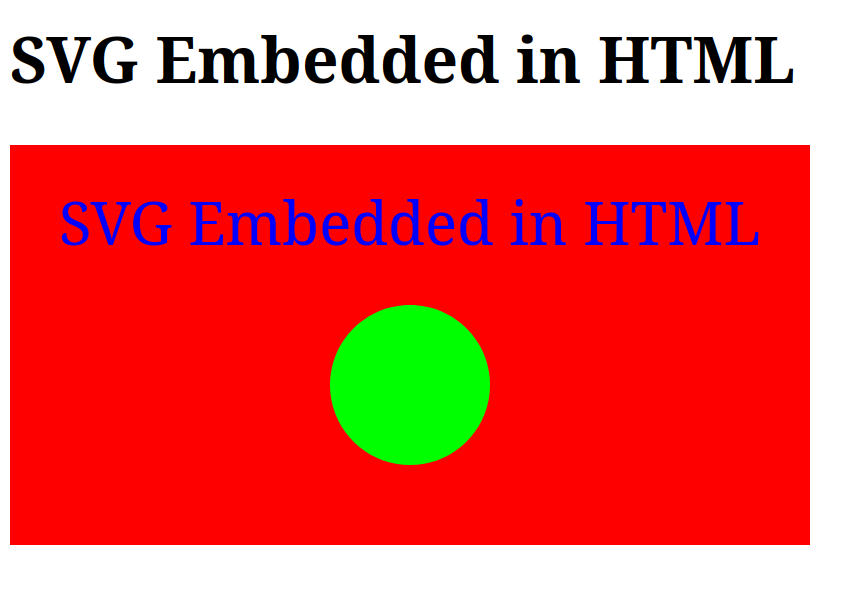
One way is to embed the svg tag in the HTML file as you can see in the following example. Between the opening and closing svg tags we can add all the instructions to draw the image.
In our case there is a rectangle drawn using the rect element, a circle and some text. Each tag has its own attributes.
Having the SVG embedded in the HTML means that the browser does not need an extra request to load it, but on the other hand it cannot reuse the same SVG image between pages.
<html>
    <head>
        <title>SVG Embedded in HTML</title>
    </head>
<body>

<h1>SVG Embedded in HTML</h1>

<svg width="400" height="200" xmlns="http://www.w3.org/2000/svg">
  <rect width="100%" height="100%" fill="red" />
  <circle cx="200" cy="120" r="40" fill="rgb(0, 255, 0)" />
  <text x="200" y="50" font-size="30"
     text-anchor="middle" fill="blue">SVG Embedded in HTML</text>
</svg>

</body>
</html>
The above HTML file will render to this image:
SVG loaded in an img
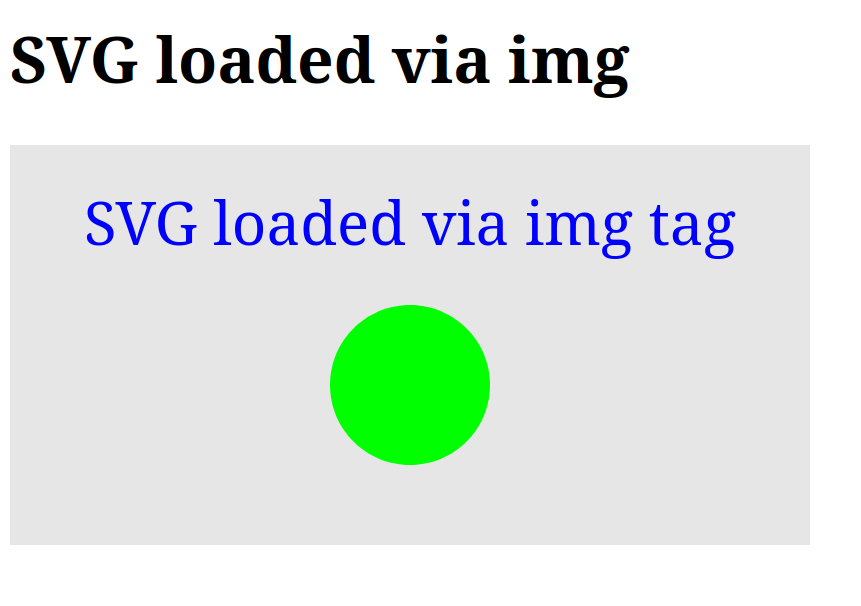
In many cases it is probbably better to separate the SVG content from the HTML itself with all the usual pro and contra reasons.
Pro:
- separating the SVG file allows the developer to vide and edit it separately
- browsers can cache the svg image and this if the same image is reused on multiple page the browser does not need to load the data several times.
Contra:
- Browsers need to make a separate request to load each SVG file.
Move the SVG part to a separate file with .svg extension:
<svg width="400" height="200" xmlns="http://www.w3.org/2000/svg">
  <rect width="100%" height="100%" fill="rgb(230, 230, 230)" />
  <circle cx="200" cy="120" r="40" fill="rgb(0, 255, 0)" />
  <text x="200" y="50" font-size="30"
     text-anchor="middle" fill="blue">SVG loaded via img tag</text>
</svg>
In the HTML document refer to the file via an img tag:
<html>
    <head>
        <title>SVG loaded via img</title>
    </head>
<body>

<h1>SVG loaded via img</h1>

<img src="load-svg-via-img.svg">

</body>
</html>
The page is rendered like this:
SVG loaded in an object
Certain features do not work when using the HTML img tag to display an SVG file. Specifically the embedding of other images in the SVG file using the image tag of SVG does not work.
Nor can one link using the a SVG tag.
Using object solves these problems.
In this example we have embedded the SVG file from the previous example.
<html>
    <head>
        <title>SVG loaded via object</title>
    </head>
<body>

<h1>SVG loaded via object</h1>

<object data="load-svg-via-object.svg" type="image/svg+xml"></object>

</body>
</html>
<svg width="400" height="400" xmlns="http://www.w3.org/2000/svg">
  <rect width="100%" height="100%" fill="rgb(30, 230, 230)" />
  <circle cx="200" cy="120" r="40" fill="rgb(255, 0, 0)" />
  <text x="200" y="50" font-size="30"
     text-anchor="middle" fill="blue">SVG loaded via object</text>

  <image x="10" y="200" width="300" href="load-svg-via-img.svg" />
</svg>
SVG loaded in an iframe
<html>
    <head>
        <title>SVG loaded via iframe</title>
    </head>
<body>

<h1>SVG loaded via iframe</h1>

<iframe src="load-svg-via-iframe.svg"></iframe>

</body>
</html>
<svg width="400" height="200" xmlns="http://www.w3.org/2000/svg">
  <rect width="100%" height="100%" fill="rgb(30, 30, 230)" />
  <circle cx="200" cy="120" r="40" fill="rgb(250, 250, 250)" />
  <text x="200" y="50" font-size="30"
     text-anchor="middle" fill="white">SVG loaded via iframe</text>
</svg>
Inkscape
Inkscape is an open source desktop application to draw SVG images. It is similart to Gimp, if you wish, but the file format it uses is SVG.
SVG validation
xmllint (part of libxml2)
sudo apt install libxml2-utils
xmllint --noout yourfile.svg
prints nothing and sets exit code to 0 on success
print error message and sets exit code to non-0 on failure
Check XML validity, but not specific to SVG.
One could use the SVG DTD.
svglint (Node.js-based)
SVG-specific linting beyond just XML structure. Requires node.js
npm install -g svglint
svglint yourfile.svg
svgcheck (Python script)
Checking if an SVG file follows the SVG spec more closely.
Install:
pip install svgcheck
Usage:
svgcheck yourfile.svg
W3C Validator (Local via Docker)
The W3C Markup Validator can be run locally via Docker for comprehensive validation.
docker run -v $(pwd):/var/www:ro validator/validator /var/www/yourfile.svg
Convert SVG to PNG or JPEG
There are cases when you need to supply a raster image. Eg. a system that does not (yet ?) support SVG. How can we convert an SVG image to a raster image?
There are number of tools to do this.
Convert SVG to PNG or JPEG using ImageMagick
To install on Ubuntu:
sudo apt install imagemagick
On the command line run:
convert input.svg output.png
Convert SVG to PNG or JPEG using Inkscape
To install on Ubuntu:
sudo apt install inkscape
On the command line run:
inkscape --export-filename=output.png input.svg
Using The Gnome Image Viewer
It is also called the Eye of Gnome or eog.
We can open the image with the viewer by double-clicking on the SVG file in the file-explorer or by running:
eog input.svg
To convert click on the hamburger menu, select “Save As” and save as a .png file.
Style
There are two ways to set the style/color of the shapes. Using these 3 attributes or using the style attribute.
strokethe color of the “pen” (e.g. the line, the outline of a shape etc.)stroke-widththe width of the line in pixels.fillthe color of the internal part of certain shapes. (e.g. a circle and a rectangle will have this, a line will not).
stroke="blue"
stroke-width="4"
fill="yellow"
There is also a an attribute called style
style
In this case all the styling fields are part of the value of the style attribute.
- Colon
:separates between name and value. - Semi-colon
;separates between fields. - No quotes around the individual values.
style="stroke:blue;stroke-width:4;fill:yellow"
Colors
- Some colors have names: black, white, red, green, blue, purple, etc. (See the CSS colors).
- We can express colors as RGB in hexa:
#DE23F1. - We can use the single letters:
#A73which is the same as#AA7733. - We can use decimal numbers
rgb(23, 42, 17)for the Red, Green, and Blue values.
fill="blue"
fill="#DE23F1"
fill="#A73"
fill="rgb(23, 42, 17)"
g container element
- Element g to group elements and to apply various attributes to all of them via inheritance.

In this example we see 2 sets of 3 circles. If you look at the definition of the circles you will see that both sets have the exact same parameters. So how come that the red set is lower?
Both sets are inside g elements. For the second set the g element has an attribute called transform that has a value translate(0, 80). Despite its name it moves all the elements
inside the g-tag horizontally and vertically. Specifically this moves the 3 red circles 80 pixels down.
You can also observe that in each set the circles overlap and one circle hides parts of the other two. They way SVG draws is from top to bottom in the file. Shapes that are later in the file will be drawn on top of the shapes that came earlier in the file. On a later page we’ll see how to make some of the shapes transparent, but for now the shapes are not and thus we cannot see parts of the earlier shapes.
<svg viewBox="0 0 300 300" xmlns="http://www.w3.org/2000/svg">
  <g fill="white" stroke="blue" stroke-width="5">
    <circle cx="40" cy="40" r="25" />
    <circle cx="80" cy="40" r="25" />
    <circle cx="60" cy="60" r="25" />
  </g>

  <g fill="white" stroke="red" stroke-width="5" transform="translate(0, 80)">
    <circle cx="40" cy="40" r="25" />
    <circle cx="80" cy="40" r="25" />
    <circle cx="60" cy="60" r="25" />
  </g>
</svg>
Transformations

<svg width="400" height="400" xmlns="http://www.w3.org/2000/svg">
  <polygon points="100,0 100,50 60,120" fill="#2ABFB5" stroke-width="3" />
  <polygon points="100,0 100,50 60,120" fill="red" stroke-width="3"  transform="rotate(10, 100, 0)" />
  <polygon points="100,0 100,50 60,120" fill="blue" stroke-width="3"  transform="translate(20,0)" />
</svg>
transform
- rotate
- translate
- …
Size vs ViewBox
The svg element can have attributes width and height in pixels to define the size of the image and it can have an attrbute called ViewBox.
width and height are the actual size of the image on the screen, the rendered size. (Well, assuming there are not external forces to change that.)
ViewBox is an internal coordinate system viewBox="X Y width height" where X, Y are the coordinates of the top-left corner and width and height are well, the dimensions of the coordinate system.
I think one should almost always use ViewBox.
Size

<img width="100px" src="../examples/size.svg">
<img width="300px" src="../examples/size.svg">
<svg width="200" height="200" xmlns="http://www.w3.org/2000/svg">
  <rect width="100%" height="100%" fill="white" stroke="black" stroke-width="1" />
  <rect width="100" height="50" fill="blue" />
</svg>
ViewBox
A regular img tag in the HTML will allow the SVG to take up all the width in the current HTML tag.

We can set the width or height element of the img tag (but preferably not both) to set the actual size of the image.
<img width="100px" src="../examples/viewbox.svg">
<svg viewBox="0 0 200 200" xmlns="http://www.w3.org/2000/svg">
  <rect width="100%" height="100%" fill="white" stroke="black" stroke-width="1" />
  <rect width="100" height="50" fill="blue" />
</svg>
Links
- Links don’t work if we are embedding the svg using
imgtags, but usingobjectthey work.
<object data="../examples/links.svg" type="image/svg+xml"></object>
<svg viewBox="0 0 300 100" xmlns="http://www.w3.org/2000/svg">
  <a href="https://rust.code-maven.com/" target="_blank">
     <text x="5" y="15" fill="red">Rust</text>
  </a>
  <a href="https://perlmaven.com/" target="_blank">
    <circle cx="40" cy="40" r="15" fill="blue" />
  </a>

 <defs>
    <linearGradient id="grad1" x1="0%" x2="100%" y1="0%" y2="0%">
      <stop offset="0%" stop-color="#4B8BBE" />
      <stop offset="100%" stop-color="#FFD43B" />
    </linearGradient>
  </defs>

  <a href="https://python.code-maven.com/" target="_blank">
    <rect width="80" height="40" x="0" y="60" fill="url(#grad1)" />
  </a>
</svg>
Shapes
- Lines
- Circles
- Rectangles
- Polygons
- Polylines
- Ellipse
Lines
Blue diagonal line
<svg width="300" height="200" xmlns="http://www.w3.org/2000/svg">
  <line
   x1="0" y1="0"
   x2="300" y2="200"
   stroke="blue"
   stroke-width= "5" />
</svg>

Purple Horizontal line
<svg  width="300" height="50" xmlns="http://www.w3.org/2000/svg">
  <line
    x1="0" y1="30"
    x2="250" y2="30"
    stroke="purple"
    stroke-width="10" />
</svg>

Purple Vertical line
<svg width="300" height="100" xmlns="http://www.w3.org/2000/svg">
  <line
    x1="0" y1="0"
    x2="0" y2="100"
    stroke="red"
    stroke-width="14" />
</svg>

Circle
<svg width="100" height="100" xmlns="http://www.w3.org/2000/svg">
  <circle
    cx="50" cy="50" r="40"
    stroke="green"
    stroke-width="4"
    fill="yellow" />
</svg>

Rectangle
<svg width="150" height="100" xmlns="http://www.w3.org/2000/svg">
  <rect width="100%" height="100%" fill="green" />
  <rect width="70" height="50" x="20"  y="20" fill="blue" />
</svg>

Rectangles
Violet - setting the color in 4 different ways
<svg width="150" height="100" xmlns="http://www.w3.org/2000/svg">

  <rect width="40" height="40" fill="#F06"/>

  <rect width="40" height="40" x="110" style="fill:#F06"/>

  <rect width="40" height="40" y="60" fill="rgb(255, 0, 66)"/>

  <rect width="40" height="40" x="110" y="60" style="fill:rgb(255, 0, 66)"/>
</svg>

-
fillsets the background color of a shape, e.g. a rectangle. -
fillsets the background color. -
strokesets the color of the border. -
stroke-widthsets the width (in pixels) of th border. -
We can also use
styleto set all 3 attributes.
Set the width and height as a percentage
<svg width="150" height="100" xmlns="http://www.w3.org/2000/svg">
  <rect width="100%" height="100%" />
</svg>

Rectangle without color (without fill)
We can create a rectangle exactly the same width and height as the full image and wihout setting the fill attribute it will be black:
<svg width="150" height="100" xmlns="http://www.w3.org/2000/svg">
  <rect width="150" height="100" />
</svg>

White rectangle with border
<svg width="150" height="100" xmlns="http://www.w3.org/2000/svg">
  <rect width="40" height="100" fill="#FFF" stroke="black" stroke-width="1" />
  <rect width="40" height="100" x="110" style="fill:#FFF;stroke:black;stroke-width:1" />
</svg>

Rectangle with rounded corner
<svg width="300" height="200" xmlns="http://www.w3.org/2000/svg">
  <rect width="300" height="200"
    fill="blue"
    rx="20"
    ry="40"
    />
</svg>

rxry
Square
A square is just a rectangle where all the sides are the same length. Nothing special.
<svg width="150" height="150" xmlns="http://www.w3.org/2000/svg">
  <rect width="25%" height="25%" fill="green" />
  <rect width="50" height="50" x="70"  y="70" fill="blue" />
</svg>

Ellipse
<svg width="150" height="150" xmlns="http://www.w3.org/2000/svg">
  <rect width="100%" height="100%" fill="white" stroke="black" stroke-width="1" />
  <ellipse rx="75" ry="40" cx="75" cy="75" fill="green" />
</svg>

rxis the horizontal radius (so half of the width of the ellipe).ryis the vertical radious (so half of the hight of the ellipse).cxis the horizontal center of the ellipse.cyis the vertical center of the ellipse.
Polygon
A list of points (x, y) coordinates that generated a closed shape. That is the every two points are connected and also the last point is connected to the first point.
Triangle
<svg width="150" height="100" xmlns="http://www.w3.org/2000/svg">
  <polygon points="0,0 100,50 50,100" style="fill:#2ABFB5;stroke-width:3" />
</svg>

Square using Polygon
<svg width="150" height="100" xmlns="http://www.w3.org/2000/svg">
  <polygon points="50,0 100,0  100,50  50,50" style="fill:#2ABFB5;stroke-width:3" />
</svg>

Hexagon using Polygon
<svg width="300" height="300" xmlns="http://www.w3.org/2000/svg">
  <polygon points="
    150,15
    258,77
    258,202
    150,265
    42,202
    42,77
  " style="fill:#2ABFB5;stroke:black;stroke-width:3" />
</svg>

5 pointed star
<svg width="220" height="228" xmlns="http://www.w3.org/2000/svg">
  <rect width="100%" height="100%" fill="white" stroke="black" stroke-width="1" />
  <polygon points="
    110,20
    50,208
    200,88
    20,88
    170,208
    "
    fill="#2ABFB5"
    stroke="black"
    stroke-width="3"
    />
</svg>

   <!-- fill-rule="evenodd" -->

Triangle
<svg width="150" height="100" xmlns="http://www.w3.org/2000/svg">
  <polygon points="0,60 75,0 150,60" style="fill:#2ABFB5;stroke-width:3" />
</svg>

Star of David
Star of David
In Hebrew it is called the Shield of David.
This one is built of 2 triangles of equal sides that can be drawn using 2 polygon. There is some basic math behind the triangles to calculate the height of the triangle. Some more math to place the two triangles on top of each other.
I’ve added a rectangle around it to make it stand out.
<svg width="220" height="249" xmlns="http://www.w3.org/2000/svg">
  <rect width="100%" height="100%" fill="white" stroke="black" stroke-width="1" />
  <polygon points="
    10,66
    210,66
    110,239
    "
    fill="none"
    stroke="#0038b8"
    stroke-width="10"
    />

  <polygon points="
    10,183
    210,183
    110,10
    "
    fill="none"
    stroke="#0038b8"
    stroke-width="10"
    />
</svg>

Polyline
A polyline is a series of (x,y) points in which every two adjacent point is connected with a line. Unlike in a polygon, in this case the last point is NOT connected to the first one leaving the polyline “open”.
Polyline W
<svg height="210" width="500" xmlns="http://www.w3.org/2000/svg">
  <polyline
     points="
        10,10
        50,70
        90,10
        130,70
        170,10
     "
    fill="none"
    stroke="cyan"
    stroke-width="3"
  />
</svg>

Polyline Snail
<svg height="210" width="500" xmlns="http://www.w3.org/2000/svg">
  <polyline
     points="
        10,10
        190,10
        190,190
        20,190
        20,20
        180,20
        180,180
        30,180
        30,30
        170,30
        170,170
        40,170
        40,40
        160,40
        160,160
        50,160
        50,50
        150,50
        150,150
        60,150
        60,60
        140,60
        140,140
        70,140
        70,70
        130,70
        130,130
        80,130
        80,80
        120,80
        120,120
        90,120
        90,90
        110,90
        110,110
        100,110
        100,100
     "
     style="fill:none;stroke:red;stroke-width:3" />
</svg>

Path
- M = moveto (move from one point to another point)
- L = lineto (create a line)
- H = horizontal lineto (create a horizontal line)
- V = vertical lineto (create a vertical line)
- C = curveto (create a curve)
- S = smooth curveto (create a smooth curve)
- Q = quadratic Bézier curve (create a quadratic Bézier curve)
- T = smooth quadratic Bézier curveto (create a smooth quadratic Bézier curve)
- A = elliptical Arc (create a elliptical arc)
- Z = closepath (close the path)
Upper case means absolutely positioned, lower case means relatively positioned.
Diagonal line with Path

<svg height="210" width="400" xmlns="http://www.w3.org/2000/svg">
  <path d="M10 15 L75 200"
  stroke="blue"
  stroke-width="3" />
</svg>
Triangle with Path

<svg height="210" width="400" xmlns="http://www.w3.org/2000/svg">
  <path d="M150 5 L75 200 L225 200 Z"
  fill="none"
  stroke="blue"
  stroke-width="3" />
</svg>
Path Arc

<svg viewBox="0 0 300 150" xmlns="http://www.w3.org/2000/svg">

    <path d="M 100 100 L 100 50 A 50 50 0 0 1 143.3 125 Z"
                fill="lightblue"
                stroke="black"
                stroke-width="2"/>

    <path d="M 100 100 L 100 50"
                fill="lightblue"
                stroke="red"
                stroke-width="2"/>

</svg>
Path Transparency

<svg viewBox="0 0 250 250" xmlns="http://www.w3.org/2000/svg">
    <rect width="100%" height="100%" fill="white" />
    <!-- Rectangle (bottom layer) -->
    <path d="M 50 80 L 200 80 L 200 220 L 50 220 Z"
          fill="#ff6b6b"
          stroke="#333"
          stroke-width="2"/>

    <!-- Circle (middle layer - hides part of rectangle) -->
    <circle cx="30" cy="80" r="40"
            fill="#4ecdc4"
            stroke="#333"
            stroke-width="2"/>

    <!-- Octagon (top layer - partially transparent) -->
    <path d="M 180 120
             L 210 120
             L 230 140
             L 230 170
             L 210 190
             L 180 190
             L 160 170
             L 160 140 Z"
          fill="#45b7d1"
          fill-opacity="0.6"
          stroke="#333"
          stroke-width="2"/>

</svg>
Path Code Maven logo
![]()
<svg viewBox="0 0 290 290" xmlns="http://www.w3.org/2000/svg">
    <rect width="100%" height="100%" fill="#1a1a1a"/>
    <path d="M 100 100 L 50 150 L 100 200"
          stroke="#00aaff"
          stroke-width="10"
          fill="none"
          stroke-linecap="square"
          stroke-linejoin="miter"/>

    <text x="110" y="170"
          text-anchor="middle"
          font-family="monospace"
          font-size="60"
          fill="#808080">%</text>

    <path d="M 120 100 L 170 135 L 150 150 L 170 165 L 120 200"
          stroke="#00aaff"
          stroke-width="10"
          fill="none"
          stroke-linecap="round"
          stroke-linejoin="round"/>

</svg>
stroke-linejoinmiterroundbevel
stroke-linecapbuttroundsquare
Path Examples

Text
<svg width="150" height="100" xmlns="http://www.w3.org/2000/svg">
  <rect width="100%" height="100%" border="black"
     style="fill:white;stroke-width:3;stroke:black" />
  <text x="75" y="60" font-size="30" text-anchor="middle" fill="red">Text</text>
</svg>

-
x - The start of the text. Defaults to 0.
-
y - The start of the text. Defaults to 0.
-
dx - Delta
-
dy - Delta
-
rotate
-
textLength
-
lengthAdjust
-
text-anchor
- start
- middle
- end
Text with stroke (border) and no fill (color)
<svg width="150" height="100" xmlns="http://www.w3.org/2000/svg">
  <rect width="100%" height="100%" border="black"
     style="fill:white;stroke-width:3;stroke:black" />
  <text x="75" y="60" font-size="30" text-anchor="middle" stroke="red" fill="none">Text</text>
</svg>

tspan to add style to part of the text
tspan to add style to part of the text
<svg width="650" height="100" xmlns="http://www.w3.org/2000/svg">
  <rect width="100%" height="100%" border="black"
     style="fill:white;stroke-width:3;stroke:black" />
  <text x="30" y="60" font-size="30" text-anchor="start" stroke="red" fill="blue">
    Some text
    <tspan fill="yellow">with tspan</tspan>
    and then more text.
  </text>
</svg>

Text with letters rotated
<svg width="300" height="100" xmlns="http://www.w3.org/2000/svg">
  <rect width="100%" height="100%" border="black"
     style="fill:white;stroke-width:3;stroke:black" />
  <text x="10" y="60" font-size="30" text-anchor="start" fill="blue" rotate="20">Some rotated text</text>
</svg>

rotatein degree clockwise - 0 is the default
Rotate the whole text with transform
<svg width="350" height="350" xmlns="http://www.w3.org/2000/svg">
  <rect width="100%" height="100%" border="black"
     style="fill:white;stroke-width:3;stroke:black" />
  <text x="10" y="60" font-size="30" text-anchor="start" fill="blue" transform="rotate(0, 0, 0)">Some rotated text</text>
  <text x="10" y="60" font-size="30" text-anchor="start" fill="red" transform="rotate(90, 10, 60)">Some rotated text</text>
</svg>

transformrotate(angle [, cx, cy])
Rotates the element by angle degrees clockwise. If you provide cx and cy, it rotates around that point; otherwise, it rotates around the origin (0,0).
<svg width="500" height="100" xmlns="http://www.w3.org/2000/svg">
  <rect width="100%" height="100%" border="black"
     style="fill:white;stroke-width:3;stroke:black" />
  <text x="10" y="60" font-size="30" text-anchor="start" fill="blue">Some moved text</text>
  <text x="10" y="60" font-size="30" text-anchor="start" fill="red" transform="translate(50, 20)">Some moved text</text>
</svg>

translate(tx [, ty])
Moves (shifts) the element by tx units horizontally and ty units vertically. If ty is omitted, it’s assumed to be 0.
Embed external image
The image tag can be used to embed images. It supports the emebedding of other SVG files and PNG and JPEG images.
Certain features do not work when using the img tag to display an SVG file, specifically the embedding of other images in the SVG file using the image tag that we’ll see later. Using object solves this problem.
<svg    width="200" height="200" xmlns="http://www.w3.org/2000/svg">
  <rect width="100%" height="100%" fill="none" stroke="black" stroke-size="1" />

  <image x="10" y="10" width="100" height="100" href="rectangle.svg" />
  <image x="10" y="100" width="50" height="50" href="circle.svg" />

</svg>
Horizontal linear gradient
<svg width="400" height="150" xmlns="http://www.w3.org/2000/svg">
  <defs>
    <linearGradient id="grad1" x1="0%" x2="100%" y1="0%" y2="0%">
      <stop offset="0%" stop-color="blue" />
      <stop offset="100%" stop-color="green" />
    </linearGradient>
  </defs>
  <rect width="300" height="70" x="85" y="55" fill="url(#grad1)" />
</svg>

Charts
TODO
Draw charts with svg Draw coordinates and a line, box chart.
Stacked chart

<svg width="50" height="1000" xmlns="http://www.w3.org/2000/svg">
  <rect width="100%" height="12%" y="0"   fill="green" />
  <rect width="100%" height="17%" y="120" fill="blue" />
  <rect width="100%" height="71%" y="290" fill="purple" />
</svg>
Pie chart
I created the SVG file with the rectangle in VS Code and then asked co-pilot to: “add a piechart to the svg file”. It created this example and gave me an explanation of it. There are also comments in the SVG file that help me navigate.
I coul dhave probably told co-pilot exactly the size of each part, which colors to use and what to write on the legend, but for now this looks ok.
I also noticed a small issue with the image. The text of the “legend” in the top left corner slightly overlaps with the pie-char itself. I assume I could have asked co-pilot to move the legend a bit higher up or, if I understood the syntax of SVG I could edit the file myself to move the legend.
The biggest issue, however, is that this would assume that I already know all this information and I can manually type it in the prompt of co-pilot. What if the percentages and the names of the parts are generated by some software? Then I’d probably want that software to generat the pie-chart itself.
So I asked co-pilot to “Write a python function that will get the segments as parameters and will generate a similar SVG file”. It created a nice solution in Python though it did not use any 3rd party library. It was a few hundred lines of code. Not something I’d like to keep maintaining.
So I asked “is there a 3rd party library that could be used instead of implementing the creation of the chart?”
It suggested Pygal, Matplotlib, and Plotly.
I believe I could have further asked co-pilot to generate the pie-chart using one of the libraries, but I felt this was enough for the demonstration.

<svg width="500" height="500" xmlns="http://www.w3.org/2000/svg">
  <rect width="100%" height="100%" stroke="black" stroke-width="1" fill="white" />

  <!-- Pie Chart centered at (250, 250) with radius 150 -->
  <g transform="translate(250, 250)">

    <!-- Segment 1: 40% - Red -->
    <path d="M 0,0 L 150,0 A 150,150 0 0,1 46.35,142.66 Z"
          fill="#FF6B6B" stroke="white" stroke-width="2"/>

    <!-- Segment 2: 30% - Blue -->
    <path d="M 0,0 L 46.35,142.66 A 150,150 0 0,1 -121.35,92.71 Z"
          fill="#4ECDC4" stroke="white" stroke-width="2"/>

    <!-- Segment 3: 20% - Green -->
    <path d="M 0,0 L -121.35,92.71 A 150,150 0 0,1 -136.60,-54.41 Z"
          fill="#45B7D1" stroke="white" stroke-width="2"/>

    <!-- Segment 4: 10% - Orange -->
    <path d="M 0,0 L -136.60,-54.41 A 150,150 0 0,1 150,0 Z"
          fill="#FFA07A" stroke="white" stroke-width="2"/>

    <!-- Center circle (optional - creates a donut effect) -->
    <circle cx="0" cy="0" r="30" fill="white" stroke="#666" stroke-width="1"/>

  </g>

  <!-- Legend -->
  <g transform="translate(50, 50)">
    <rect x="0" y="0" width="15" height="15" fill="#FF6B6B"/>
    <text x="20" y="12" font-family="Arial" font-size="14" fill="black">Segment 1 (40%)</text>

    <rect x="0" y="25" width="15" height="15" fill="#4ECDC4"/>
    <text x="20" y="37" font-family="Arial" font-size="14" fill="black">Segment 2 (30%)</text>

    <rect x="0" y="50" width="15" height="15" fill="#45B7D1"/>
    <text x="20" y="62" font-family="Arial" font-size="14" fill="black">Segment 3 (20%)</text>

    <rect x="0" y="75" width="15" height="15" fill="#FFA07A"/>
    <text x="20" y="87" font-family="Arial" font-size="14" fill="black">Segment 4 (10%)</text>
  </g>

</svg>
Drawings
House front
<svg width="150" height="100" xmlns="http://www.w3.org/2000/svg">
  <polygon points="40,60 75,20 110,60" fill="#2ABFB5" />
  <rect width="70" height="50" x="40"  y="60" fill="blue" />
</svg>

- A square (or rectangle) and a triangle on the top.
Flags
Flag of Hungary
- Using
pathbased on the version on the Wikipedia

<svg xmlns="http://www.w3.org/2000/svg" width="1200" height="600">
   <path d="M0   0 H1200 V200 H0" fill="#ce2939"/>
   <path d="M0 200 H1200 V400 H0" fill="#fff"/>
   <path d="M0 400 H1200 V600 H0" fill="#477050"/>
</svg>
A path can be used to define complex shapes, but in this case the shapes are rather simple. 3 rectangles.
In the path element we can provide commands.
Mmeans move to (x,y) coordinates. So the first line say Move to coordinates (0, 0).Hmeans move horizontally to the x coordinate. So H1200 means move to (1200, 0).Vmeans move vertically to the y coordinate So V200 means to move (1200, 200).H0means move to the x=0 coordinate.
Each path element also has a color associated with it in the fill attribute.
- Using
rectIn this solution we draw 3 rectangles of the appropriatewidth,heightplacing them at variousycoordinates (xdefaults to 0) and filling them with the appropriate color.
<svg xmlns="http://www.w3.org/2000/svg" width="1200" height="600">
    <rect width="1200" height="200" y="0"   fill="#ce2939" />
    <rect width="1200" height="200" y="200" fill="#fff" />
    <rect width="1200" height="200" y="400" fill="#477050" />
</svg>

Flag of Switzerland
<svg xmlns="http://www.w3.org/2000/svg" width="512" height="512" viewBox="0 0 32 32">
    <path d="M0 0 H32 V32 H-32 Z" fill="#f00"/>
    <path d="M13 6 h6 v7 h7 v6 h-7 v7 h-6 v-7 h-7 v-6 h7 z" fill="#fff"/>
</svg>

Flag of Israel
<?xml version="1.0"?>
<svg xmlns="http://www.w3.org/2000/svg" width="1100" height="800">
  <path d="M 0,0 H 1100 V 800 H 0 Z" fill="#fff"/>
  <path d="M 0,75 H 1100 V 200 H 0 Z" fill="#0038b8"/>
  <path d="M 0,600 H 1100 V 725 H 0 Z" fill="#0038b8"/>
  <path d="M 423.81566,472.85253 H 676.18435 L 550.00001,254.29492 Z m 126.18435,72.85255 126.1843,-218.55765 H 423.81566 Z" fill="none" stroke="#0038b8" stroke-width="27.5"/>
</svg>

SVG generated programmatically
TODO: This section needs a lot more examples
- JavaScript
- Python
- Perl
- Rust
- etc.
SVG generated by JavaScript
TODO
See SVG with JavaScript examples.
SVG using Perl
You can also generate SVG using a Perl module called, SVG and a plethora of other SVG related modules.
I assume that if you would like to use Perl then you know how to install the SVG module from CPAN, so I’ll just show a number of examples.
TODO: See more SVG in Perl examples.
Default SVG
Probably the most basic use of the module is to generate an SVG image without any content.
After loading the module we create an instance using the new method and then render the SVG using the xmlify method.
You can print the resulting string to the screen as we do in this example or you could have saved it in a file directly. It all depends on your use-case.
use strict;
use warnings;
use SVG;

my $svg= SVG->new();
print $svg->xmlify();
The generated SVG looks like this: (I added some newlines to make the lines shorter to fit on the page).
<?xml version="1.0" encoding="UTF-8" standalone="yes"?>
<!DOCTYPE svg PUBLIC "-//W3C//DTD SVG 1.0//EN"
   "http://www.w3.org/TR/2001/REC-SVG-20010904/DTD/svg10.dtd">
<svg height="100%" width="100%"
   xmlns="http://www.w3.org/2000/svg"
   xmlns:svg="http://www.w3.org/2000/svg"
   xmlns:xlink="http://www.w3.org/1999/xlink">
	<!--
	Generated using the Perl SVG Module V2.87
	by Ronan Oger

	-->
</svg>
It has a lot of text besides what is strictly necessary.
There are the xml and DOCTYPE tags
The svg tag has xmlns, xmlns:svg, xmlns:xlink fields besides height and width.
After that there is a comment with the giving credit to the Perl module and the original author of the module.
You can keep these or you can make the SVG file a bit smaller by removing some of the unnecessary parts.
Plain SVG: inline and without credits
Inline SVG and no credits
Passing the -inline flag to the new method will remove the xml, DOCTYPE tags.
Passing the -nocredits flag will remove the comment with the credit.
I could not find a way to totally eliminate the xmlns:svg and xmlns:xlink attributes.
use strict;
use warnings;
use SVG;

my $svg= SVG->new(-nocredits => 1, -inline => 1);
print $svg->xmlify();
The resulting SVG (after adding some newlines to make all the rows fit on the screen):
<svg height="100%" width="100%"
  xmlns="http://www.w3.org/2000/svg"
  xmlns:svg="http://www.w3.org/2000/svg"
  xmlns:xlink="http://www.w3.org/1999/xlink" />
Inline SVG and no credit at load time
Alternatively we could set the -inline and -nocredits parameters when we first load the module into memory.
That will change the default behaviour of the library and thus in we don’t need to pass the flags to the constructor.
use strict;
use warnings;
use SVG (-nocredits => 1, -inline => 1);

my $svg= SVG->new();
print $svg->xmlify();
The resulting SVG is the same as in the prevous case.
<svg height="100%" width="100%"
   xmlns="http://www.w3.org/2000/svg"
   xmlns:svg="http://www.w3.org/2000/svg"
   xmlns:xlink="http://www.w3.org/1999/xlink" />
Line using Perl
The code:
use strict;
use warnings;
use SVG (-nocredits => 1, -inline => 1);

my $svg= SVG->new( width => 200, height => 200);
$svg->line(
    x1 =>  0,
    y1 =>  0,
    x2 => 200,
    y2 =>  200,
    style => "stroke:blue;stroke-width:5",
);

$svg->line(
    x1 =>  0,
    y1 =>  200,
    x2 => 200,
    y2 =>  0,
    stroke => "red",
    "stroke-width" => 5,
);

# green horizontal line
$svg->line(
    x1 =>  0,
    y1 =>  50,
    x2 =>  200,
    y2 =>  50,
    stroke => "#0F0",
    "stroke-width" => 5,
);


# vertical line
$svg->line(
    x1 =>  50,
    y1 =>  0,
    x2 =>  50,
    y2 =>  200,
    stroke => "rgb(86, 126, 169)",
    "stroke-width" => 5,
);


print $svg->xmlify();
The generated SVG
<svg height="200" width="200" xmlns="http://www.w3.org/2000/svg" xmlns:svg="http://www.w3.org/2000/svg" xmlns:xlink="http://www.w3.org/1999/xlink">
	<line style="stroke:blue;stroke-width:5" x1="0" x2="200" y1="0" y2="200" />
	<line stroke="red" stroke-width="5" x1="0" x2="200" y1="200" y2="0" />
	<line stroke="#0F0" stroke-width="5" x1="0" x2="200" y1="50" y2="50" />
	<line stroke="rgb(86, 126, 169)" stroke-width="5" x1="50" x2="50" y1="0" y2="200" />
</svg>
The image:

Circle using Perl
The code:
use strict;
use warnings;
use SVG (-nocredits => 1, -inline => 1);

my $svg= SVG->new( width => 200, height => 200);
$svg->circle( cx => 100, cy => 100, fill => "#f37", r => 50);
print $svg->xmlify();
The generated SVG
<svg height="200" width="200" xmlns="http://www.w3.org/2000/svg" xmlns:svg="http://www.w3.org/2000/svg" xmlns:xlink="http://www.w3.org/1999/xlink">
	<circle cx="100" cy="100" fill="#f37" r="50" />
</svg>
The image:

Rectangle using Perl
The code:
use strict;
use warnings;
use SVG (-nocredits => 1, -inline => 1);

my $svg= SVG->new( width => 200, height => 200);
$svg->rectangle(
    x      => 10,
    y      => 20,
    width  => 180,
    height => 120,
    rx     => 10,
    ry     => 30,
    fill   => "#3a83c5",
);
print $svg->xmlify();
The generated SVG
<svg height="200" width="200" xmlns="http://www.w3.org/2000/svg" xmlns:svg="http://www.w3.org/2000/svg" xmlns:xlink="http://www.w3.org/1999/xlink">
	<rect fill="#3a83c5" height="120" rx="10" ry="30" width="180" x="10" y="20" />
</svg>
The image:

Grid using Perl
With these 3 images we are trying to show how higher resolution makes the pixels “disappear”. In all 3 images we are drawing a diagonal line.
The images
In the first image we have a resolution of 3x3 and thus the diagonal line consists of 3 pixels. It is very clear that these are pixels.

In the second image the resolution is 10x10. We can still clearly see the pixels, but we can also see that the line is a bit smoother.

In the third image the resolution is even better. It is 120x120 pixels. Due to the frequency of the grid lines the image is almost black, but those lines are only there so we can see the resolution. The diagonal seems to be smooth. People with good eyes can still see that it is made out of individual pixels, but many people will already miss that.

If we increased the resolution even further, (eg. my external screen is 2560x1440 pixels and the built-in screen of my notebook is 3840x2400 pixels) the line would seem totally smooth.
The code:
In this case it was written in Perl, but we have examples in other languages as well.
use strict;
use warnings;
use SVG (-nocredits => 1, -inline => 1);

my $IMAGE_WIDTH = 400;
my $IMAGE_HEIGHT = 400;
my $DEFAULT_NUMBER_OF_PIXELS = 20;

die "Usage: $0 WIDTH (in real pixels) HEIGHT (in real pixels) SIZE (how many real pixels is the side of a pixel in the grid)\n"
    if @ARGV != 3;

my ($width, $height, $size) = @ARGV;
my $svg = draw_grid(@ARGV);
draw_diagonal_line($svg, @ARGV);
print $svg->xmlify();

sub draw_diagonal_line {
    my ($svg, $width, $height, $size) = @_;
    for my $box (1..$height/$size) {
        # horizontal line
        $svg->rectangle(
            x =>  ($box-1) * $size,
            y =>  ($box-1) * $size,
            width =>  $size,
            height =>  $size,
            fill => "red",
        );
    }

}


sub draw_grid {
    my ($width, $height, $size) = @_;
    die "Width of $width cannot be divided by $size\n"
        if $width / $size != int($width / $size);
    die "Height of $height cannot be divided by $size\n"
        if $height / $size != int($height / $size);

    my $svg = SVG->new( width => $width, height => $height);

    for my $row (0..$height/$size) {
        # horizontal line
        $svg->line(
            x1 =>  0,
            y1 =>  $row * $size,
            x2 =>  $width,
            y2 =>  $row * $size,
            stroke => "black",
            "stroke-width" => 1,
        );
    }


    for my $column (0..$width/$size) {
        # vertical line
        $svg->line(
            x1 =>  $column * $size,
            y1 =>  0,
            x2 =>  $column * $size,
            y2 =>  $height,
            stroke => "black",
            "stroke-width" => 1,
        );
    }
    return $svg;
}
$ perl src/examples/perl/grid.pl 600 600 200 > src/examples/perl/grid-600-600-200.svg
$ perl src/examples/perl/grid.pl 600 600 60 > src/examples/perl/grid-600-600-60.svg
$ perl src/examples/perl/grid.pl 600 600 5 > src/examples/perl/grid-600-600-2.svg
SVG using Rust
The svg crate seems to be quite popular.
Line
[package]
name = "line"
version = "0.1.0"
edition = "2024"

[dependencies]
svg = "0.18.0"
use svg::Document;
use svg::node::element::Line;

fn main() {
    let document = Document::new().set("viewBox", (0, 0, 70, 70)).add(
        Line::new()
            .set("x1", 10)
            .set("y1", 10)
            .set("x2", 10)
            .set("y2", 60)
            .set("stroke", "black")
            .set("stroke-width", 3),
    );

    svg::save("line.svg", &document).unwrap();
}
<svg viewBox="0 0 70 70" xmlns="http://www.w3.org/2000/svg">
<line stroke="black" stroke-width="3" x1="10" x2="10" y1="10" y2="60"/>
</svg>

Book cover
I’ve started to publish books on LeanPub. In this section you’ll find the SVG images used to generate the book covers.
Functional Programming in Python

<svg    width="2100" height="3000" xmlns="http://www.w3.org/2000/svg">
  <rect width="100%" height="2000"          fill="#DDDDDD" />
  <rect width="100%" height="1000" y="2000" fill="black" />

  <text x="1050" y="400" font-size="270" text-anchor="middle" fill="black">Functional</text>
  <text x="1050" y="750" font-size="270" text-anchor="middle" fill="black">Programming</text>
  <text x="1050" y="1500" font-size="270" text-anchor="middle" fill="black">in Python</text>

  <text x="350" y="2700" font-size="200" text-anchor="left" fill="yellow">by Gábor Szabó</text>
</svg>
Testing Python

<svg    width="2100" height="3000" xmlns="http://www.w3.org/2000/svg">
  <rect width="100%" height="2000"          fill="#DDDDDD" />
  <rect width="100%" height="1000" y="2000" fill="black" />

  <text x="1050" y="400" font-size="270" text-anchor="middle" fill="black">Testing</text>
  <text x="1050" y="750" font-size="270" text-anchor="middle" fill="black">Applications</text>
  <text x="1050" y="1100" font-size="270" text-anchor="middle" fill="black">written</text>
  <text x="1050" y="1450" font-size="270" text-anchor="middle" fill="black">in Python</text>

  <text x="350" y="2700" font-size="200" text-anchor="left" fill="yellow">by Gábor Szabó</text>
</svg>
Python Testing Demo

<svg    width="2100" height="3000" xmlns="http://www.w3.org/2000/svg">
  <rect width="100%" height="2000"          fill="#DDDDDD" />
  <rect width="100%" height="1000" y="2000" fill="black" />

  <text x="1050" y="400" font-size="270" text-anchor="middle" fill="black">Python Testing</text>
  <text x="1050" y="750" font-size="270" text-anchor="middle" fill="black">A</text>
  <text x="1050" y="1100" font-size="270" text-anchor="middle" fill="black">Micro</text>
  <text x="1050" y="1450" font-size="270" text-anchor="middle" fill="black">Tutorial</text>

  <text x="350" y="2700" font-size="200" text-anchor="left" fill="yellow">by Gábor Szabó</text>
</svg>
Python Tk

<svg    width="2100" height="3000" xmlns="http://www.w3.org/2000/svg">
  <rect width="100%" height="2000"          fill="#DDDDDD" />
  <rect width="100%" height="1000" y="2000" fill="black" />

  <text x="1050" y="400" font-size="270" text-anchor="middle" fill="black">Desktop GUI</text>
  <text x="1050" y="750" font-size="270" text-anchor="middle" fill="black">using</text>
  <text x="1050" y="1100" font-size="270" text-anchor="middle" fill="black">Python</text>
  <text x="1050" y="1450" font-size="270" text-anchor="middle" fill="black">Tk</text>

  <text x="350" y="2700" font-size="200" text-anchor="left" fill="yellow">by Gábor Szabó</text>
</svg>
Python Flask

<svg    width="2100" height="3000" xmlns="http://www.w3.org/2000/svg">
  <rect width="100%" height="2000"          fill="#DDDDDD" />
  <rect width="100%" height="1000" y="2000" fill="black" />

  <text x="1050" y="400" font-size="270" text-anchor="middle" fill="black">Web</text>
  <text x="1050" y="750" font-size="270" text-anchor="middle" fill="black">Application</text>
  <text x="1050" y="1100" font-size="270" text-anchor="middle" fill="black">using</text>
  <text x="1050" y="1450" font-size="270" text-anchor="middle" fill="black">Python</text>
  <text x="1050" y="1800" font-size="270" text-anchor="middle" fill="black">Flask</text>

  <text x="350" y="2700" font-size="200" text-anchor="left" fill="yellow">by Gábor Szabó</text>
</svg>
Python FastAPI

<svg    width="2100" height="3000" xmlns="http://www.w3.org/2000/svg">
  <rect width="100%" height="2000"          fill="#DDDDDD" />
  <rect width="100%" height="1000" y="2000" fill="black" />

  <text x="1050" y="400" font-size="270" text-anchor="middle" fill="black">Web</text>
  <text x="1050" y="750" font-size="270" text-anchor="middle" fill="black">Application</text>
  <text x="1050" y="1100" font-size="270" text-anchor="middle" fill="black">using</text>
  <text x="1050" y="1450" font-size="270" text-anchor="middle" fill="black">Python</text>
  <text x="1050" y="1800" font-size="270" text-anchor="middle" fill="black">FastAPI</text>

  <text x="350" y="2700" font-size="200" text-anchor="left" fill="yellow">by Gábor Szabó</text>
</svg>
Python Regular Expressions

<svg    width="2100" height="3000" xmlns="http://www.w3.org/2000/svg">
  <rect width="100%" height="2000"          fill="#DDDDDD" />
  <rect width="100%" height="1000" y="2000" fill="black" />

  <text x="1050" y="400" font-size="270" text-anchor="middle" fill="black">Regular</text>
  <text x="1050" y="750" font-size="270" text-anchor="middle" fill="black">Expressions</text>
  <text x="1050" y="1100" font-size="270" text-anchor="middle" fill="black">in Python</text>
<!--
  <text x="1050" y="1450" font-size="270" text-anchor="middle" fill="black">in Python</text>
-->

  <text x="350" y="2700" font-size="200" text-anchor="left" fill="yellow">by Gábor Szabó</text>
</svg>
OOP in Perl

<svg    width="2100" height="3000" xmlns="http://www.w3.org/2000/svg">
  <rect width="100%" height="2000"          fill="#EEEEEE" />
  <rect width="100%" height="1000" y="2000" fill="black" />

  <text x="1050" y="400" font-size="200" text-anchor="middle" fill="black">OOP</text>
  <text x="1050" y="900" font-size="200" text-anchor="middle" fill="black">Object Oriented</text>
  <text x="1050" y="1200" font-size="200" text-anchor="middle" fill="black">Programming</text>
  <text x="1050" y="1500" font-size="200" text-anchor="middle" fill="black">in Perl</text>


  <text x="750" y="2700" font-size="150" text-anchor="left" fill="yellow">by Gábor Szabó</text>
</svg>
Oneliners in Perl

<svg    width="2100" height="3000" xmlns="http://www.w3.org/2000/svg">
  <rect width="100%" height="2000"          fill="#EEEEEE" />
  <rect width="100%" height="1000" y="2000" fill="black" />

  <text x="1050" y="400" font-size="160" text-anchor="middle" fill="black">perl -E 'say "Hello World!"'</text>
  <text x="1050" y="1200" font-size="200" text-anchor="middle" fill="black">Oneliners</text>
  <text x="1050" y="1500" font-size="200" text-anchor="middle" fill="black">in Perl</text>


  <text x="750" y="2700" font-size="150" text-anchor="left" fill="yellow">by Gábor Szabó</text>
</svg>
Clap

<svg    width="2100" height="3000" xmlns="http://www.w3.org/2000/svg">
  <rect width="100%" height="2000"          fill="#DDDDDD" />
  <rect width="100%" height="1000" y="2000" fill="black" />

  <text x="1050" y="400" font-size="270" text-anchor="middle" fill="black">Clap</text>
  <text x="1050" y="750" font-size="270" text-anchor="middle" fill="black">Command Line</text>
  <text x="1050" y="1100" font-size="270" text-anchor="middle" fill="black">Argument Parser</text>
  <text x="1050" y="1450" font-size="270" text-anchor="middle" fill="black">for Rust</text>

  <text x="350" y="2700" font-size="200" text-anchor="left" fill="yellow">by Gábor Szabó</text>
</svg>
Rust programming

<svg    width="2100" height="3000" xmlns="http://www.w3.org/2000/svg">
  <rect width="100%" height="2000"          fill="#DDDDDD" />
  <rect width="100%" height="1000" y="2000" fill="black" />

  <text x="1050" y="400" font-size="270" text-anchor="middle" fill="black">Rust</text>
  <text x="1050" y="750" font-size="270" text-anchor="middle" fill="black">Programming</text>
<!--
  <text x="1050" y="1100" font-size="270" text-anchor="middle" fill="black">written</text>
  <text x="1050" y="1450" font-size="270" text-anchor="middle" fill="black">in Python</text>
-->

  <text x="350" y="2700" font-size="200" text-anchor="left" fill="yellow">by Gábor Szabó</text>
</svg>
Rust and JSON

<svg    width="2100" height="3000" xmlns="http://www.w3.org/2000/svg">
  <rect width="100%" height="2000"          fill="#DDDDDD" />
  <rect width="100%" height="1000" y="2000" fill="black" />

  <text x="1050" y="400" font-size="270" text-anchor="middle" fill="black">JSON</text>
  <text x="1050" y="750" font-size="270" text-anchor="middle" fill="black">Handling</text>
  <text x="1050" y="1100" font-size="270" text-anchor="middle" fill="black">with</text>
  <text x="1050" y="1450" font-size="270" text-anchor="middle" fill="black">Rust</text>

  <text x="350" y="2700" font-size="200" text-anchor="left" fill="yellow">by Gábor Szabó</text>
</svg>
Liquid in Rust

<svg    width="2100" height="3000" xmlns="http://www.w3.org/2000/svg">
  <rect width="100%" height="2000"          fill="#DDDDDD" />
  <rect width="100%" height="1000" y="2000" fill="black" />

  <text x="1050" y="400" font-size="270" text-anchor="middle" fill="black">Liquid</text>
  <text x="1050" y="750" font-size="270" text-anchor="middle" fill="black">Templating</text>
  <text x="1050" y="1100" font-size="270" text-anchor="middle" fill="black">in</text>
  <text x="1050" y="1450" font-size="270" text-anchor="middle" fill="black">Rust</text>

  <text x="350" y="2700" font-size="200" text-anchor="left" fill="yellow">by Gábor Szabó</text>
</svg>
Other
Some other images we might want to discuss in the book.
Python logo
The Python logo taken from here.
<?xml version="1.0" encoding="UTF-8" standalone="no"?>
<!-- Created with Inkscape (http://www.inkscape.org/) -->

<svg
   version="1.0"
   id="svg2"
   sodipodi:version="0.32"
   inkscape:version="1.2.1 (9c6d41e410, 2022-07-14)"
   sodipodi:docname="python-logo-only.svg"
   width="83.371017pt"
   height="101.00108pt"
   inkscape:export-filename="python-logo-only.png"
   inkscape:export-xdpi="232.44"
   inkscape:export-ydpi="232.44"
   xmlns:inkscape="http://www.inkscape.org/namespaces/inkscape"
   xmlns:sodipodi="http://sodipodi.sourceforge.net/DTD/sodipodi-0.dtd"
   xmlns:xlink="http://www.w3.org/1999/xlink"
   xmlns="http://www.w3.org/2000/svg"
   xmlns:svg="http://www.w3.org/2000/svg"
   xmlns:rdf="http://www.w3.org/1999/02/22-rdf-syntax-ns#"
   xmlns:cc="http://creativecommons.org/ns#"
   xmlns:dc="http://purl.org/dc/elements/1.1/">
  <metadata
     id="metadata371">
    <rdf:RDF>
      <cc:Work
         rdf:about="">
        <dc:format>image/svg+xml</dc:format>
        <dc:type
           rdf:resource="http://purl.org/dc/dcmitype/StillImage" />
      </cc:Work>
    </rdf:RDF>
  </metadata>
  <sodipodi:namedview
     inkscape:window-height="2080"
     inkscape:window-width="1976"
     inkscape:pageshadow="2"
     inkscape:pageopacity="0.0"
     guidetolerance="10.0"
     gridtolerance="10.0"
     objecttolerance="10.0"
     borderopacity="1.0"
     bordercolor="#666666"
     pagecolor="#ffffff"
     id="base"
     inkscape:zoom="2.1461642"
     inkscape:cx="91.558698"
     inkscape:cy="47.9926"
     inkscape:window-x="1092"
     inkscape:window-y="72"
     inkscape:current-layer="svg2"
     width="210mm"
     height="40mm"
     units="mm"
     inkscape:showpageshadow="2"
     inkscape:pagecheckerboard="0"
     inkscape:deskcolor="#d1d1d1"
     inkscape:document-units="pt"
     showgrid="false"
     inkscape:window-maximized="0" />
  <defs
     id="defs4">
    <linearGradient
       id="linearGradient2795">
      <stop
         style="stop-color:#b8b8b8;stop-opacity:0.49803922;"
         offset="0"
         id="stop2797" />
      <stop
         style="stop-color:#7f7f7f;stop-opacity:0;"
         offset="1"
         id="stop2799" />
    </linearGradient>
    <linearGradient
       id="linearGradient2787">
      <stop
         style="stop-color:#7f7f7f;stop-opacity:0.5;"
         offset="0"
         id="stop2789" />
      <stop
         style="stop-color:#7f7f7f;stop-opacity:0;"
         offset="1"
         id="stop2791" />
    </linearGradient>
    <linearGradient
       id="linearGradient3676">
      <stop
         style="stop-color:#b2b2b2;stop-opacity:0.5;"
         offset="0"
         id="stop3678" />
      <stop
         style="stop-color:#b3b3b3;stop-opacity:0;"
         offset="1"
         id="stop3680" />
    </linearGradient>
    <linearGradient
       id="linearGradient3236">
      <stop
         style="stop-color:#f4f4f4;stop-opacity:1"
         offset="0"
         id="stop3244" />
      <stop
         style="stop-color:white;stop-opacity:1"
         offset="1"
         id="stop3240" />
    </linearGradient>
    <linearGradient
       id="linearGradient4671">
      <stop
         style="stop-color:#ffd43b;stop-opacity:1;"
         offset="0"
         id="stop4673" />
      <stop
         style="stop-color:#ffe873;stop-opacity:1"
         offset="1"
         id="stop4675" />
    </linearGradient>
    <linearGradient
       id="linearGradient4689">
      <stop
         style="stop-color:#5a9fd4;stop-opacity:1;"
         offset="0"
         id="stop4691" />
      <stop
         style="stop-color:#306998;stop-opacity:1;"
         offset="1"
         id="stop4693" />
    </linearGradient>
    <linearGradient
       x1="224.23996"
       y1="144.75717"
       x2="-65.308502"
       y2="144.75717"
       id="linearGradient2987"
       xlink:href="#linearGradient4671"
       gradientUnits="userSpaceOnUse"
       gradientTransform="translate(100.2702,99.61116)" />
    <linearGradient
       x1="172.94208"
       y1="77.475983"
       x2="26.670298"
       y2="76.313133"
       id="linearGradient2990"
       xlink:href="#linearGradient4689"
       gradientUnits="userSpaceOnUse"
       gradientTransform="translate(100.2702,99.61116)" />
    <linearGradient
       inkscape:collect="always"
       xlink:href="#linearGradient4689"
       id="linearGradient2587"
       gradientUnits="userSpaceOnUse"
       gradientTransform="translate(100.2702,99.61116)"
       x1="172.94208"
       y1="77.475983"
       x2="26.670298"
       y2="76.313133" />
    <linearGradient
       inkscape:collect="always"
       xlink:href="#linearGradient4671"
       id="linearGradient2589"
       gradientUnits="userSpaceOnUse"
       gradientTransform="translate(100.2702,99.61116)"
       x1="224.23996"
       y1="144.75717"
       x2="-65.308502"
       y2="144.75717" />
    <linearGradient
       inkscape:collect="always"
       xlink:href="#linearGradient4689"
       id="linearGradient2248"
       gradientUnits="userSpaceOnUse"
       gradientTransform="translate(100.2702,99.61116)"
       x1="172.94208"
       y1="77.475983"
       x2="26.670298"
       y2="76.313133" />
    <linearGradient
       inkscape:collect="always"
       xlink:href="#linearGradient4671"
       id="linearGradient2250"
       gradientUnits="userSpaceOnUse"
       gradientTransform="translate(100.2702,99.61116)"
       x1="224.23996"
       y1="144.75717"
       x2="-65.308502"
       y2="144.75717" />
    <linearGradient
       inkscape:collect="always"
       xlink:href="#linearGradient4671"
       id="linearGradient2255"
       gradientUnits="userSpaceOnUse"
       gradientTransform="matrix(0.562541,0,0,0.567972,-11.5974,-7.60954)"
       x1="224.23996"
       y1="144.75717"
       x2="-65.308502"
       y2="144.75717" />
    <linearGradient
       inkscape:collect="always"
       xlink:href="#linearGradient4689"
       id="linearGradient2258"
       gradientUnits="userSpaceOnUse"
       gradientTransform="matrix(0.562541,0,0,0.567972,-11.5974,-7.60954)"
       x1="172.94208"
       y1="76.176224"
       x2="26.670298"
       y2="76.313133" />
    <radialGradient
       inkscape:collect="always"
       xlink:href="#linearGradient2795"
       id="radialGradient2801"
       cx="61.518883"
       cy="132.28575"
       fx="61.518883"
       fy="132.28575"
       r="29.036913"
       gradientTransform="matrix(1,0,0,0.177966,0,108.7434)"
       gradientUnits="userSpaceOnUse" />
    <linearGradient
       inkscape:collect="always"
       xlink:href="#linearGradient4671"
       id="linearGradient1475"
       gradientUnits="userSpaceOnUse"
       gradientTransform="matrix(0.562541,0,0,0.567972,-14.99112,-11.702371)"
       x1="150.96111"
       y1="192.35176"
       x2="112.03144"
       y2="137.27299" />
    <linearGradient
       inkscape:collect="always"
       xlink:href="#linearGradient4689"
       id="linearGradient1478"
       gradientUnits="userSpaceOnUse"
       gradientTransform="matrix(0.562541,0,0,0.567972,-14.99112,-11.702371)"
       x1="26.648937"
       y1="20.603781"
       x2="135.66525"
       y2="114.39767" />
    <radialGradient
       inkscape:collect="always"
       xlink:href="#linearGradient2795"
       id="radialGradient1480"
       gradientUnits="userSpaceOnUse"
       gradientTransform="matrix(1.7490565e-8,-0.23994696,1.054668,3.7915457e-7,-83.7008,142.46201)"
       cx="61.518883"
       cy="132.28575"
       fx="61.518883"
       fy="132.28575"
       r="29.036913" />
  </defs>
  <path
     style="fill:url(#linearGradient1478);fill-opacity:1"
     d="M 54.918785,9.1927421e-4 C 50.335132,0.02221727 45.957846,0.41313697 42.106285,1.0946693 30.760069,3.0991731 28.700036,7.2947714 28.700035,15.032169 v 10.21875 h 26.8125 v 3.40625 h -26.8125 -10.0625 c -7.792459,0 -14.6157588,4.683717 -16.7499998,13.59375 -2.46181998,10.212966 -2.57101508,16.586023 0,27.25 1.9059283,7.937852 6.4575432,13.593748 14.2499998,13.59375 h 9.21875 v -12.25 c 0,-8.849902 7.657144,-16.656248 16.75,-16.65625 h 26.78125 c 7.454951,0 13.406253,-6.138164 13.40625,-13.625 v -25.53125 c 0,-7.2663386 -6.12998,-12.7247771 -13.40625,-13.9374997 C 64.281548,0.32794397 59.502438,-0.02037903 54.918785,9.1927421e-4 Z m -14.5,8.21875012579 c 2.769547,0 5.03125,2.2986456 5.03125,5.1249996 -2e-6,2.816336 -2.261703,5.09375 -5.03125,5.09375 -2.779476,-1e-6 -5.03125,-2.277415 -5.03125,-5.09375 -10e-7,-2.826353 2.251774,-5.1249996 5.03125,-5.1249996 z"
     id="path1948" />
  <path
     style="fill:url(#linearGradient1475);fill-opacity:1"
     d="m 85.637535,28.657169 v 11.90625 c 0,9.230755 -7.825895,16.999999 -16.75,17 h -26.78125 c -7.335833,0 -13.406249,6.278483 -13.40625,13.625 v 25.531247 c 0,7.266344 6.318588,11.540324 13.40625,13.625004 8.487331,2.49561 16.626237,2.94663 26.78125,0 6.750155,-1.95439 13.406253,-5.88761 13.40625,-13.625004 V 86.500919 h -26.78125 v -3.40625 h 26.78125 13.406254 c 7.792461,0 10.696251,-5.435408 13.406241,-13.59375 2.79933,-8.398886 2.68022,-16.475776 0,-27.25 -1.92578,-7.757441 -5.60387,-13.59375 -13.406241,-13.59375 z m -15.0625,64.65625 c 2.779478,3e-6 5.03125,2.277417 5.03125,5.093747 -2e-6,2.826354 -2.251775,5.125004 -5.03125,5.125004 -2.76955,0 -5.03125,-2.29865 -5.03125,-5.125004 2e-6,-2.81633 2.261697,-5.093747 5.03125,-5.093747 z"
     id="path1950" />
  <ellipse
     style="opacity:0.44382;fill:url(#radialGradient1480);fill-opacity:1;fill-rule:nonzero;stroke:none;stroke-width:15.4174;stroke-miterlimit:4;stroke-dasharray:none;stroke-opacity:1"
     id="path1894"
     cx="55.816761"
     cy="127.70079"
     rx="35.930977"
     ry="6.9673119" />
</svg>
![]()
TODO
- Venn diagrams
- Olympic 5 circles
- Perl script to generate the Star of David.
- Perl script to generate the snake.
- Assignments
- draw a house from the front and one in perspective.
- Find icons that can be used in mdbook.
- Some tool to verify if the SVG file is correct. e.g. no invalid attribute names or attribute values?